Data and Image + R Fundamentals
Key Values of Visualisations
- Record information
- Communicate information to others
- Analyse data to support reasoning
Data Models
- Formal descriptions
- Characterize data through three components
- Objects (Item of interest)
- Students, course, semesters
- Attributes (properties of data)
- Name, age, id, data, score
- Relations (how two or more objects relate)
- Student takes course, course during semester
- Objects (Item of interest)
N - Nominal (labels or Categories)
- Operations
- e.g. maths, art(course)
O - Ordered
- Operations
- e.g. A, A-, B+, B (Grade)
Q - Interval (Location of zero arbitrary)
- Operations
- Can measure distances or spans
- e.g. (3.23, -1.2) (GPS)
Q - Ration (Zero fixed)
- Operations
- Can measure ratios or portions
- e.g. 20, 19, 22, 21 (age)
Data Processing
- Data cleaning and filtering
- For quality control
- Remove (outlier, missing data)
- Modify (conversion of format)
- Data adjustment
- Depends on your task and questions to answer
- Relational algebra
- Aggregation, mean, sort, projection
- Reformatting and Integration
Data Cleaning and Filtering
- Missing Data - no measurements, redacted
- Erroneous Values - misspelling, outliers
- Type Conversion - zip code to lat-lon
- Entity Resolution - different values for the same thing
- Data Integration - effort/errors when combining data
Dimensions and Measures
Dimensions (Independent Variables)
- Discrete variables describing data (N,O)
- Categories, data, binned questions Measures (Dependent Variable)
- Data values that can be aggregated
- Numbers to be analysed
- Aggregate as sum, count, avg, std. dev
Visual Language
- Is a sign language
- Images perceived as a set of signs
- Sender encodes information in signs
- Receiver decodes information from signs
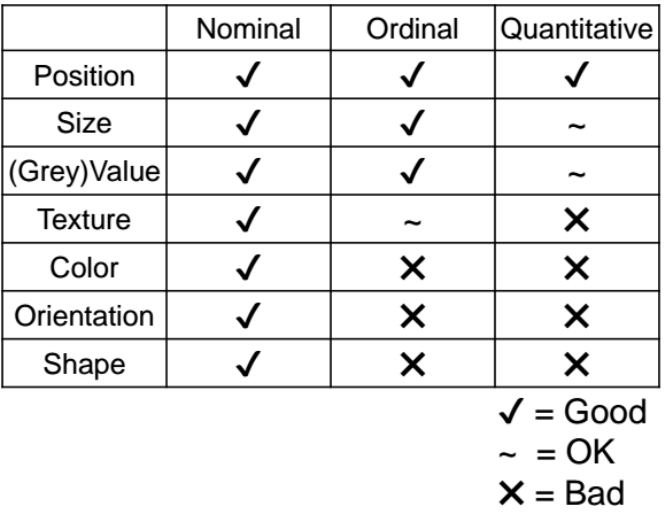
Bertins Levels of Organisation

Data Manipulations
dplyr- A grammar of data visualisation- Very intuitive, fast, easy for those migrating from SQL
- When written well, code is like a recipe
- Code the way you think
Takes the %>% operator and uses it to great effect to manipulate data frames, 5 basic 'verbs' that works with 90% of data
filter()arrange()select()mutate()summarise()